

what is this happening ? (flow Simulation)

1 Answer

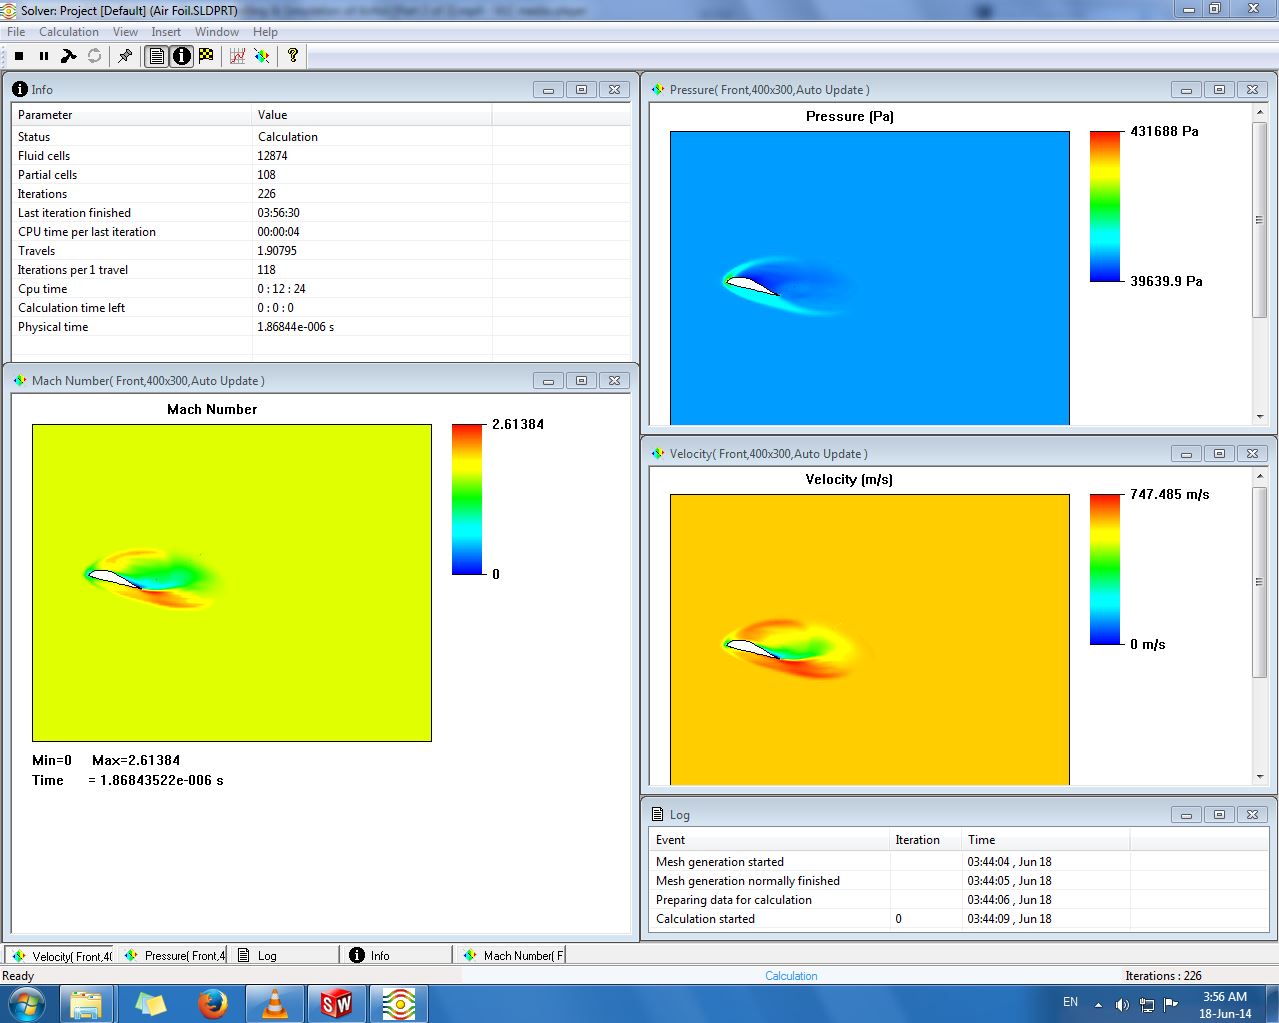
Those pics are related to the study of a profile behaviour inside a moving flow.
Let's see
Down-Left: Mach number:
A Mach number of 2.xx (high Mach) means compressible flow must be taken into account.
Up right:
Pressure distribution:(high and low are relative terms)
High pressure area (light blue) around the profile trailing edge, shows the shock wave developed by the flow compression due to the high velicity(high Mach).
High pressure below the profile is due to the flow circulation, and together with the low pressure area above it will lead to the aerodynamic/hydrodynamic forces LIFT and DRAG.
Right - lower:
Velocities distribution: Are intimately linked with pressures. More speed-lower pressure and vice versa.
For uncompressible flows, Bernoulli equation can be used, But in this example, the high Mach number means that it would not be correct.
Those graphics allow for the correction,modification,refining of the profile until matching the designer requirements..
Setting up the suitable goals for this problem, would allow for a quantitative knowledge of the profile coefficients, forces, torques ......
Regards
